Analyse, detect missed opportunities and optimise
Thanks to advanced visual analytics, data conditioning and segmentation of operating conditions, VPI allows you to identify sub-optimal operating regions and missed opportunities, detect root causes and optimise process control.
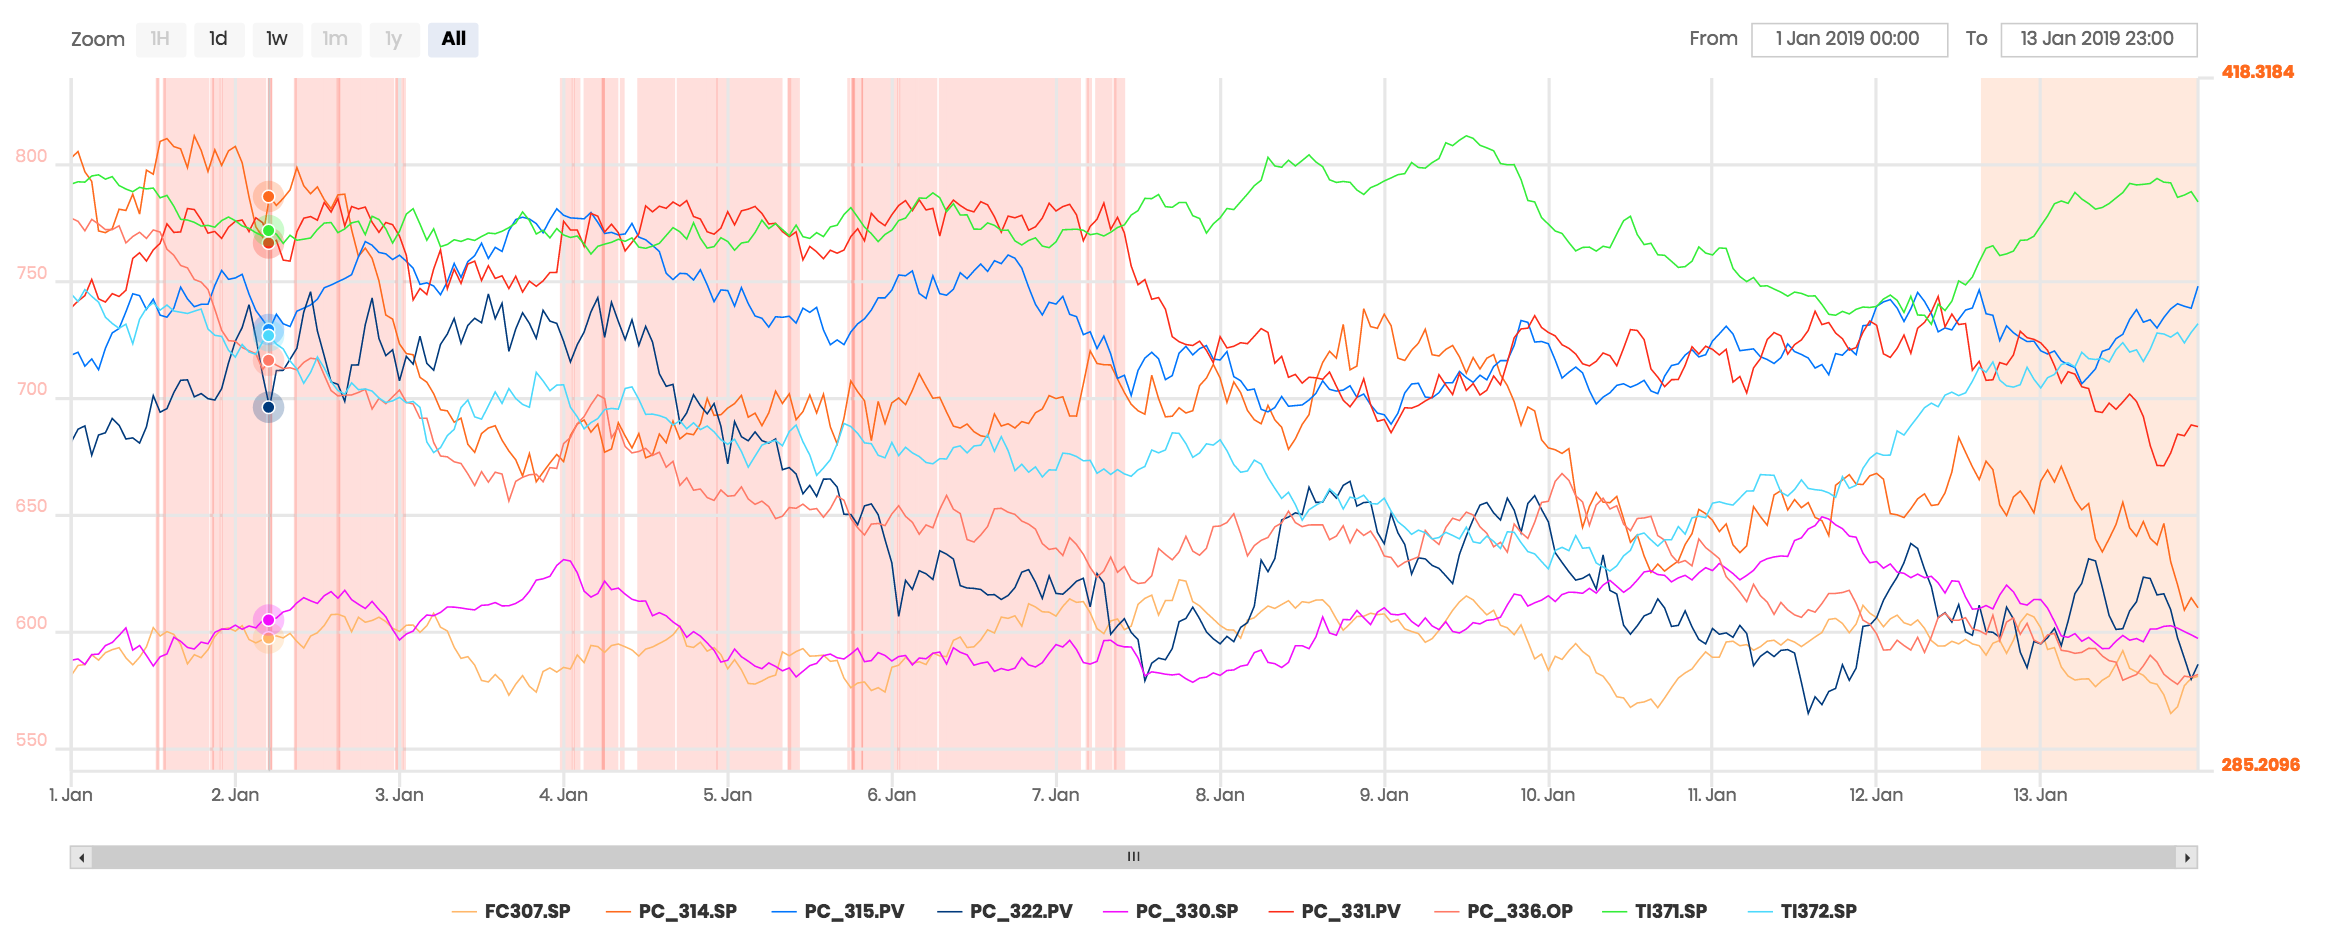
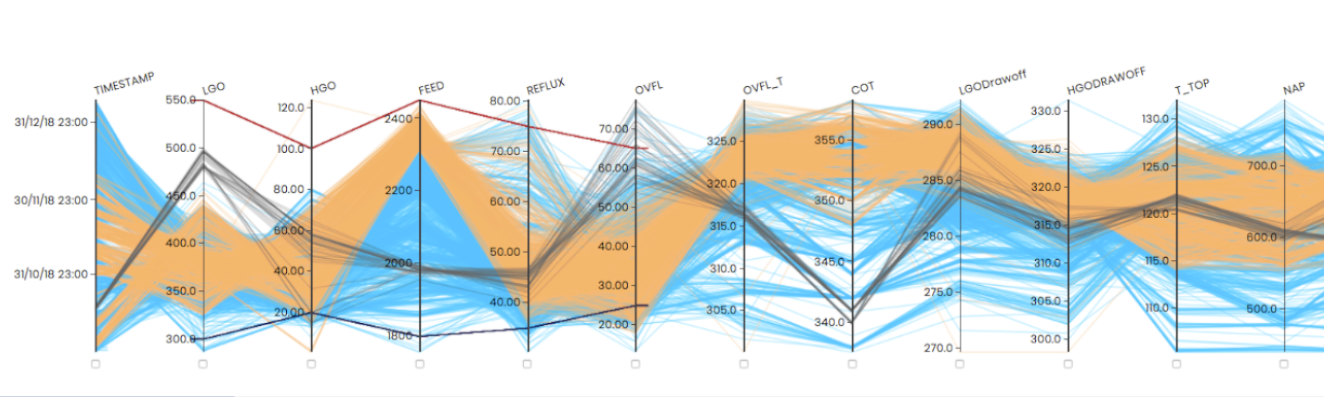
In-depth visual data inspection
VPI provides advanced charting and visual inspection tools, and introduces a best-in-class Parallel Coordinates tool for multi-variable visual analytics beyond classical trending.
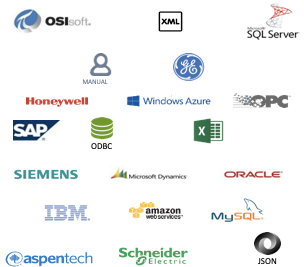
Platform and Vendor Independent - Aggregate multiple data sources
Aggregate and combine process, laboratory and off-line data from any major online data source (including classic OPC and UA), as well as from offline file-based sources.
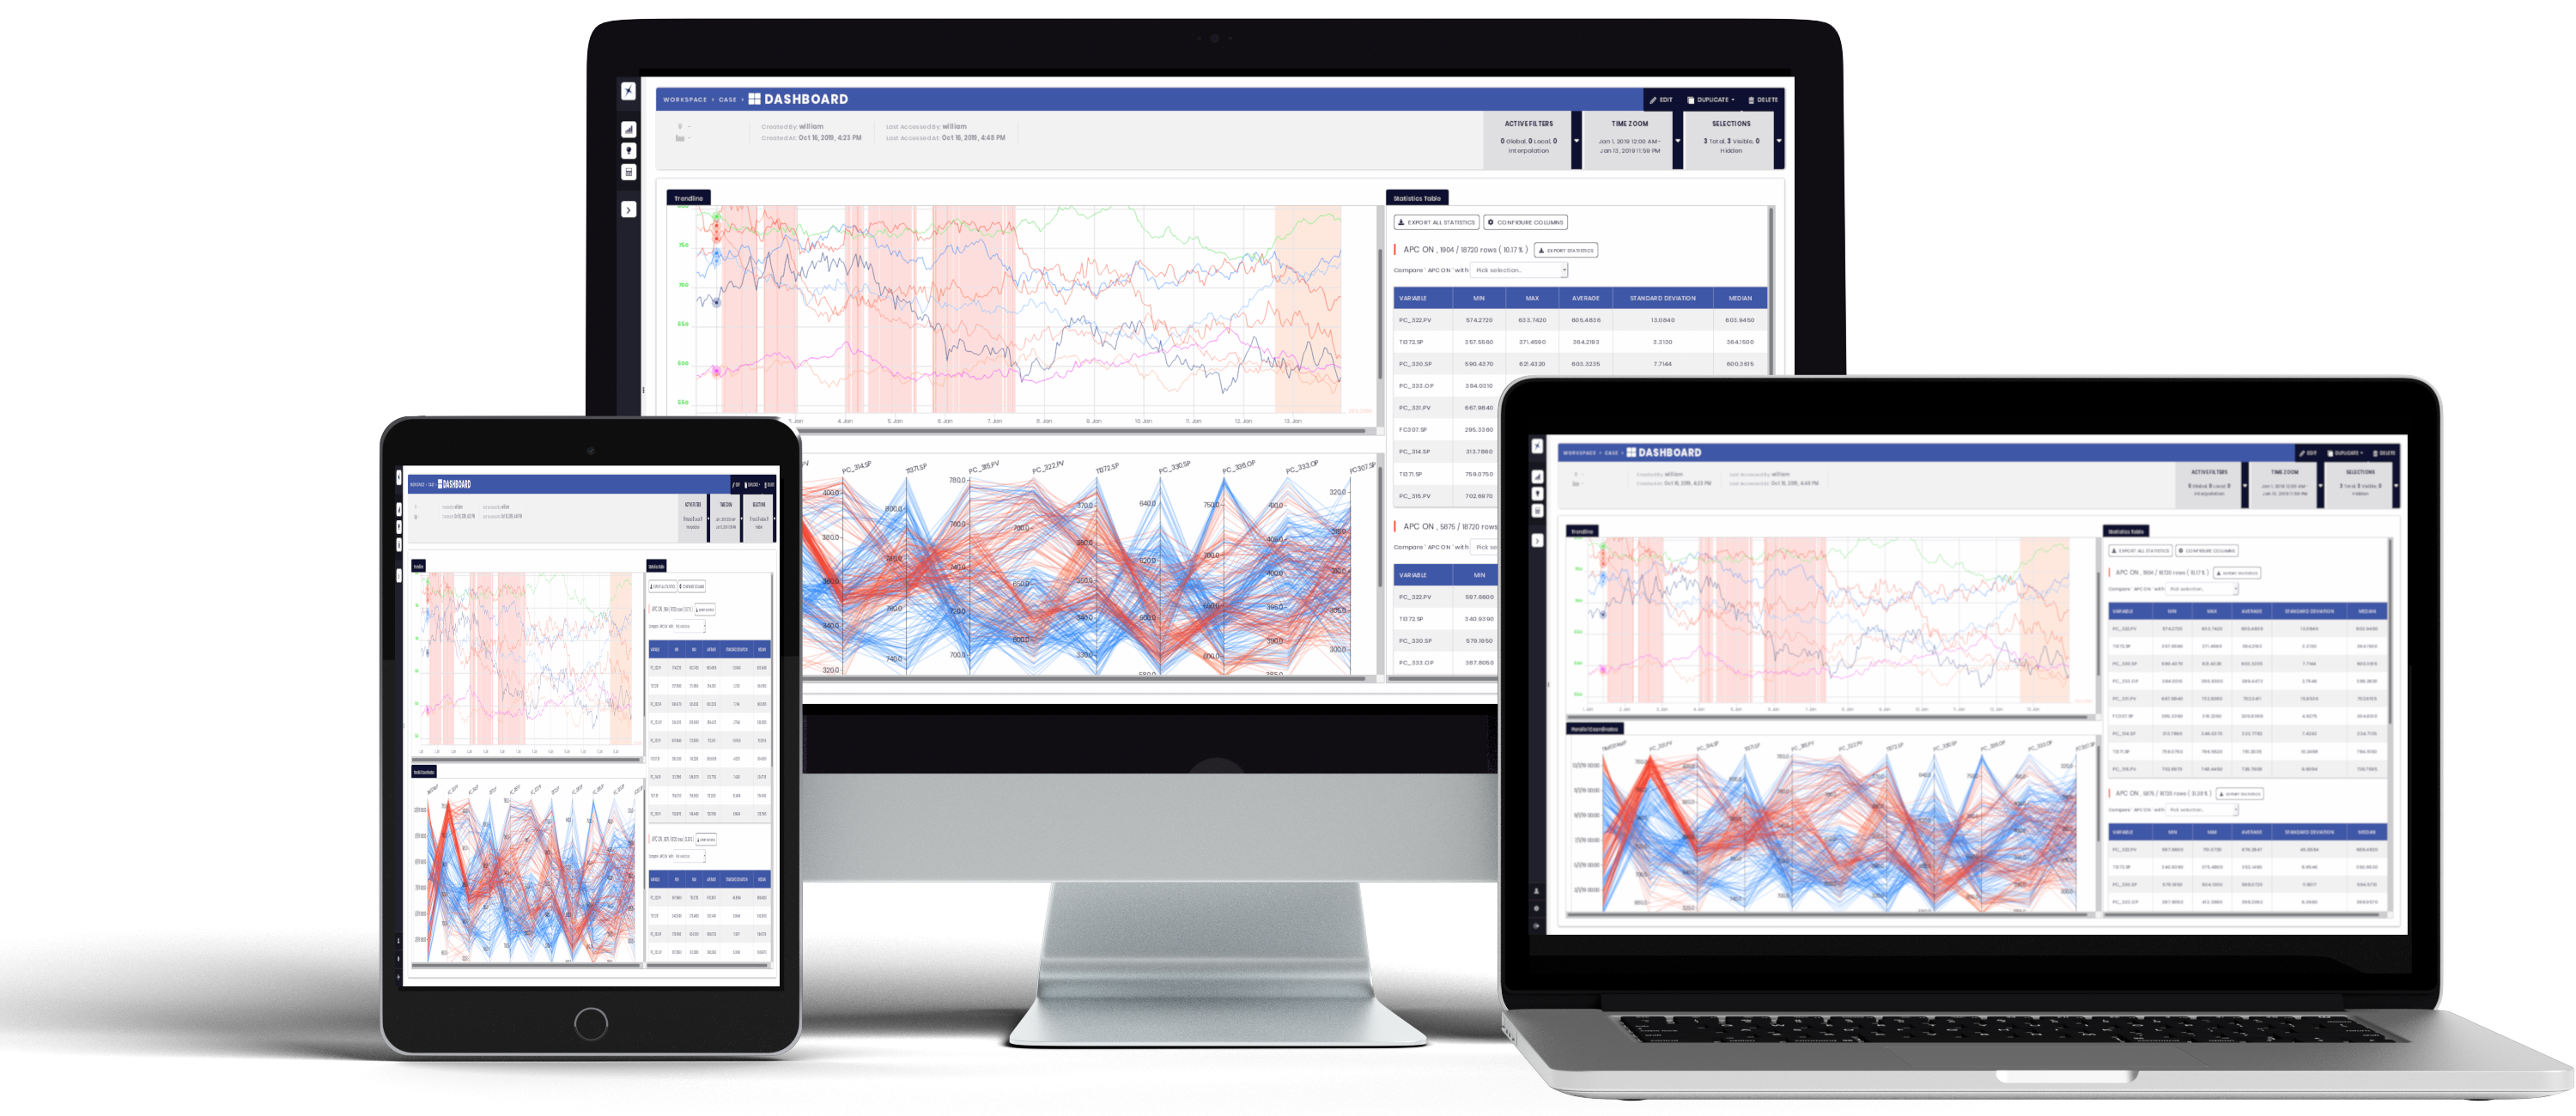
Compatible with any device
VPI can be accessed from any browser (including Google Chrome, Mozilla Firefox, Apple Safari, Microsoft Edge) making it compatible with any Desktop and Mobile device.
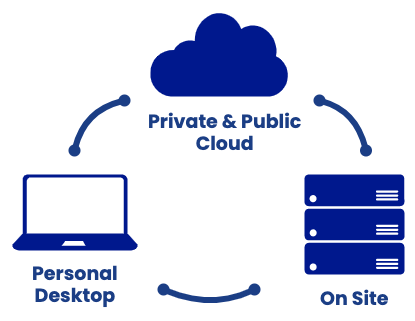
On-site, off-site and personal installations
VPI Server can be installed on Windows, Linux and macOS. Public Cloud, Private Cloud, Bare Metal and local Desktop installations are allowed through a single universal installer.